A recent history of our bay and how we can sustain its health amid population growth
For many of us who live in the Tampa Bay region, the bay itself plays an important role in our overall quality of life. Economically the bay is the lifeblood of the region, supporting about one-third of annual GDP and an estimated 660,000 jobs paying about $51B per year in the six counties that surround it (PDF). A portion of that economic activity, such as marine shipping, could occur regardless of the bay’s condition. But other activities such as tourism and recreational boating and fishing, which provide about 300,000 jobs and $22B of annual GDP, rely on a healthy estuary and good water quality. Environmentally a healthy bay provides important habitat for a large number of fish and shellfish species; more than 70% of all recreationally and commercially important saltwater species depend on estuaries like the bay at some stage of development. The bay and its watershed also provide habitat for more than 40 species of native plants and animals that are classified as threatened or endangered by government wildlife agencies.
Given its importance to our quality of life, the health of the bay needs to be kept in mind when we think about the sustainability of our work and recreational activities and other lifestyle choices. This is particularly true if we live near the shoreline or one of the streams or rivers that flow into it, since human activities in these areas can have direct impacts on the bay. But it is also true for those who live in inland portions of the watershed, because activities there can have impacts on regional air and water quality that can have indirect effects on the bay. The more we know about the environmental impacts of the things we do, the better understanding we will have of their long-term sustainability.
Recent Bay History: Degradation and Recovery
Although many current residents aren’t familiar with the story, the environmental health of the bay has fluctuated dramatically over the past several decades.
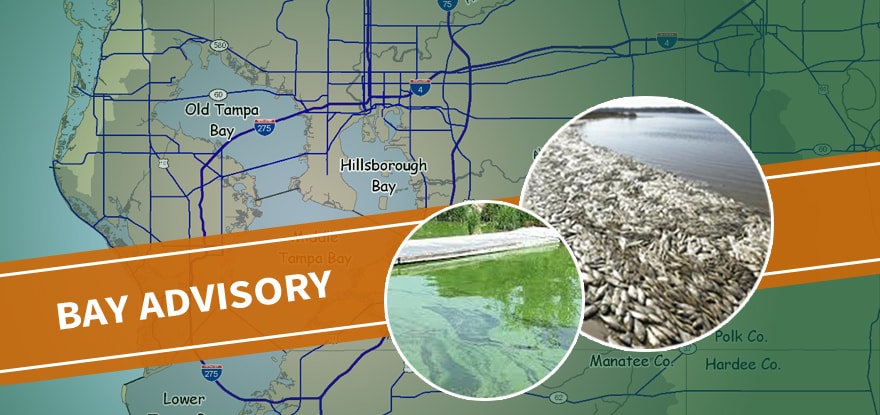
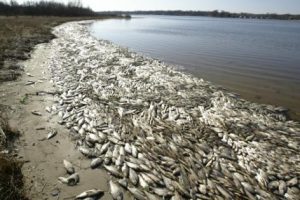 Rapid population growth that began in the 1950s, along with inadequate sewage treatment systems that could not keep up with the growth, led to major declines in the bay’s water quality during the 1960s and 1970s. Hillsborough Bay, including the shoreline of South Tampa, was particularly hard-hit, with frequent algae blooms and fish kills. These produced sights and smells, along Bayshore Boulevard and elsewhere, that drove people away from the water.
By the mid-1970s residents around the bay decided the situation had become intolerable and demanded action from their elected officials. The recently-enacted federal Clean Water Act had led to some improvements in sewage treatment, and in 1978 state legislation was passed requiring much larger improvements. Environmental regulations involving industrial waste discharges and urban stormwater management were also strengthened at the state and federal levels. By the mid-1980s bay water quality began to improve.
 A collaborative bay management effort – involving several cities and counties, other government agencies and segments of the local business community – was organized to guide and coordinate additional actions. That collaborative partnership has helped bring the bay to where it is today, with healthy water quality that is comparable to the pre-growth era of the early 1950s.
THE TAMPA BAY STORY, 1950 – 2018
Rapid population growth and declining water quality, 1950s to mid-1980s
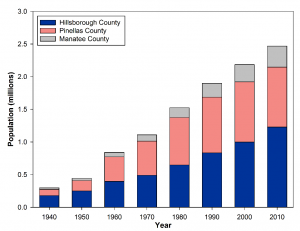
The human population of the Tampa Bay watershed increased by more than 500% over the past several decades, from less than 500,000 in 1950 to more than 2.5 million in 2010. Much of the early growth occurred near the bay shoreline and took place before the adoption of modern environmental regulations that now help to protect water quality and aquatic and wetland habitats. Many of the water quality impacts occurred during a roughly 30-year period between the early 1950s and late 1970s.
Like many other coastal waterbodies, in Florida and elsewhere, the bay’s water quality problems were primarily caused by ‘nutrient enrichment’ or over-fertilization. In the Tampa Bay watershed, as a general rule of thumb, phosphorus is the major nutrient of concern in fresh water lakes and rivers, while nitrogen is the major concern in brackish and marine water bodies such as the bay.
While both nitrogen and phosphorus are naturally-occurring nutrients that are essential for life, in large doses they are harmful. In surface water bodies excessive nutrient inputs encourage the development of dense populations of phytoplankon (free-floating microscopic algae and other micro-organisms), producing ‘algae blooms’ that degrade water quality in several ways. In addition to being unsightly, the floating cells reduce water clarity and block sunlight, which harms seagrass beds and other desirable aquatic habitats. And as the cells die and decompose, dissolved oxygen is removed from the water column and bottom sediments as part of the decomposition process.
Because an adequate supply of oxygen is essential for most organisms, such reductions can have adverse impacts on the local wildlife. Fish and other highly mobile animals are often able to disperse from areas with reduced oxygen levels, but both they and less mobile bottom-dwelling organisms can be physiologically stressed or killed by lengthy exposures to extremely low levels. Fish kills and mass die-offs of bottom-dwelling organisms were frequent events in Tampa Bay (particularly Hillsborough Bay) during the 1960s and 1970s.
Manmade nitrogen sources that have contributed to water quality problems in Tampa Bay include things such as municipal sewage discharges, stormwater runoff and nutrient-enriched industrial discharges (for example, from facilities involved in the manufacture and shipping of fertilizer products). Surprisingly, the combustion of fossil fuels for transportation and electric power generation have also been important manmade sources, contributing an estimated 25% to 65% of the manmade nitrogen entering the bay during some periods. Combustion of coal, oil and gas in power plants and vehicles releases nitrogen-containing compounds into the atmosphere, which are then returned to the surface by rainfall and other atmospheric deposition processes.
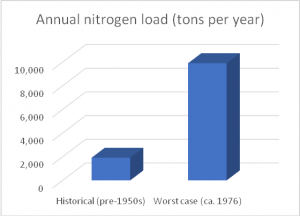
Estimates of the annual amount (or ‘load’) of nitrogen entering Tampa Bay have been calculated for the pre-1950s ‘historical’ period and the ‘worst case’ period of the mid-1970s. Annual loads during the worst case period were about 500% larger than during the historical period, explaining the water quality impacts observed in the 1970s and early 1980s.
Seagrass declines
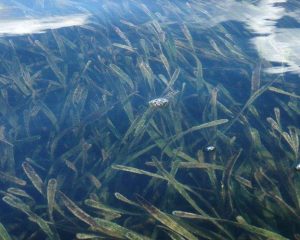
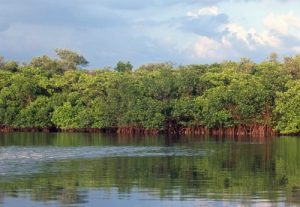
Seagrasses are a unique group of plants that have become adapted to life in brackish and marine waters. Seagrass beds provide shelter and feeding habitat for many popular fish and shellfish species, including snook, redfish, seatrout, shrimp and the bay scallop. They also serve as a food source for manatees, sea turtles and other wildlife.
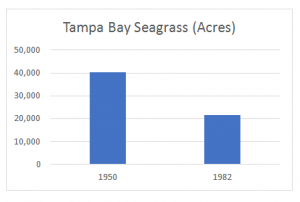
Because seagrass plants require sunlight to grow, the reductions in water clarity that occurred during the ‘bad old days’ of the 1970s and early 1980s caused large reductions in seagrass acreage in Tampa Bay. Based on analysis of aerial photographs, almost 41,000 acres were present in 1950. At the low point, in 1982, less than 22,000 acres remained, a loss of almost 50%. Much of the loss occurred in Hillsborough Bay, which had the largest nitrogen loads and poorest water clarity of all the bay segments and lost almost all of its seagrass cover.
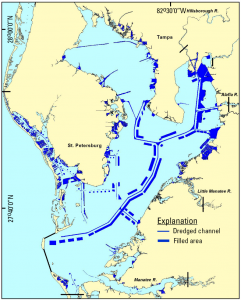
 In addition to reductions in water quality and water clarity, extensive dredge-and-fill projects conducted prior to the adoption of modern environmental regulations led to the loss of more than 13,000 acres of bay bottom, about 90% of which were shallow water areas that may have supported seagrass beds. Hillsborough Bay was once again among the most impacted parts of the bay, its surface area reduced by about 14% due to large-scale dredging and filling for the construction of shipping channels, port facilities, power stations, spoil islands and residential development.
Seagrass Acreage as a Bay Management Goal
Seagrasses have been identified as a key envi¬ronmental resource in Tampa Bay because of their critical importance in providing habitat for large numbers of fish, shellfish and other species of wildlife. They are also sensitive to water-quality degradation, and play a valuable role in nutrient cycling and improving the stability of bottom sediments.
Because seagrass acreage is such an important indicator of bay health, the local resource management community is using it to assess the effectiveness of its bay management efforts. In 1996 the Tampa Bay Estuary Program (www.tbep.org), which is a partnership of local bay management organizations, adopted a goal of returning seagrass acreage in Tampa Bay to early-1950s levels. The early 1950s was chosen as the baseline period because it preceded the period of rapid population growth that began soon thereafter, and because aerial photographs were available for the entire bay from that time, allowing accurate image-based estimation of seagrass acreage for the first time.
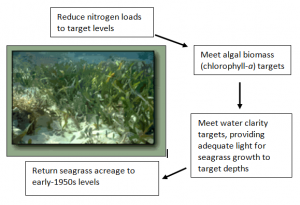
In order to meet the acreage goal, the TBEP partners developed a multi-step seagrass management strategy. Because adequate sunlight is a key component for seagrass survival and growth, the initial step was to determine the amount of sunlight needed by the seagrass species that occur in Tampa Bay. Field studies carried out in Lower Tampa Bay, where seagrass acreage has remained relatively stable since the 1950s, indicated that grassbeds there required about 20.5% of the sunlight reaching the water surface on an annual average basis. Given the water clarity that normally occurs in Lower Tampa Bay, this requirement is usually met in areas where the average water depth is six to seven feet or less, a depth that marks the deep edge of most grassbeds in that part of the bay.
Based on the 20.5% light requirement, the seagrass restoration goal was then restated as a light penetration and water clarity target. That is, in order to restore seagrass acreage to early 1950s levels in a given bay segment, water clarity in that segment would need to be restored to a point that allows at least 20.5% of surface sunlight to reach the same average bottom depth that it reached during the early 1950s. These depths ranged from about 3.3 feet in Hillsborough Bay to about 6.5 feet in Lower Tampa Bay.
Previous experience had shown that excessive nitrogen loads, and the algae blooms those additional nutrients fueled, were a primary cause of the loss of seagrasses that occurred between the early 1950s and early 1980s. In order to reverse those impacts it was necessary to express the water clarity targets in terms of algal biomass and nitrogen loadings. Algal biomass can be estimated by measuring the concentration of chlorophyll-a (a type of chlorophyll that all phytoplankon contain) in the bay’s water column. These measurements have been carried out on a monthly basis in Tampa Bay since the early 1980s, by the Environmental Protection Commission of Hillsborough County (EPC) and other local government monitoring programs. Using the monthly chlorophyll-a data and nitrogen loading estimates developed by the TBEP, numerical relationships between the two variables were identified that allowed chlorophyll-a and nitrogen loading targets to be developed for each segment of the bay.
Tampa Bay Seagrass Recovery Strategy
Implementing the Management Strategy: 1996 – present
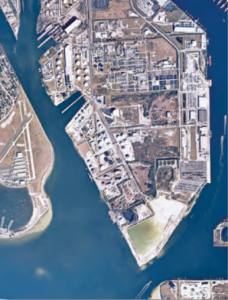
Following the low points in water quality and seagrass acreage that occurred in the late 1970s and early 1980s, local communities and industries took significant steps to reduce the amounts of nitrogen and other pollutants that are discharged to the bay. In 1979 the City of Tampa obtained federal grant funds and carried out a $100-million project to modernize its Howard F. Curren sewage treatment plant at Hookers Point, a project that sharply reduced the amount of nitrogen discharged to Hillsborough Bay. At the same time the City of St. Petersburg was initiating a wastewater reuse program in which highly treated municipal wastewater is used for landscape irrigation rather than being discharged to the bay. The City of Clearwater and other municipalities also upgraded their sewage treatment systems.
As nitrogen discharges were reduced, water quality began to improve. Improvements in chlorophyll-a concentrations and water clarity levels began in the mid-1980s and continued into the 1990s and beyond.
Examination of the long-term water quality data in 1996 indicated that the water clarity conditions that existed in the bay during the years 1992 through 1994 were adequate to meet the targets developed for the seagrass restoration strategy. This implied that the nitrogen loads that occurred during the 1992 through 1994 period also met their target values. The TBEP and its partners therefore adopted a ‘hold-the-line’ goal for nitrogen loading, keeping annual loads to each bay segment at or below the levels that occurred in 1992 – 1994.
It was clear, however, that ongoing population growth in the watershed could potentially lead to increased nitrogen being discharged to the bay, from sources such as municipal sewage treatment plants and stormwater management systems, and thus prevent the ‘hold-the-line’ nitrogen loading goal from being achieved. If annual nitrogen loads were to be maintained at 1992 – 1994 levels, additional nitrogen management projects would be needed to preclude the expected load increases (about 17 tons of additional nitrogen per year, each year) that would otherwise be generated as a result of population growth.
To achieve these nitrogen load reductions, the TBEP and its partners formed the Tampa Bay Nitrogen Management Consortium (NMC), a voluntary group that includes electric utilities, phosphate companies and other industrial concerns, agricultural interests, local governments, and state and federal regulatory agencies. Together, the NMC members developed a nitrogen management action plan and committed to implement projects to contribute to meeting the adopted management goals. The types of projects included in the plan range from traditional nutrient-reduction activities, such as municipal wastewater and stormwater treatment upgrades, industrial retrofits, and agricultural best management practices, to actions that provide nutrient reductions as a secondary benefit, such as land acquisition and habitat restoration projects.
The effectiveness of the ‘hold-the-line’ nitrogen management strategy is assessed annually by evaluating chlorophyll-a concentrations and water clarity levels measured by local monitoring programs in each bay segment during the previous calendar year and comparing those values to the segment-specific targets. During years when the water-quality targets are not met, a ‘decision-matrix’ approach is used to determine an appropriate level of management response. The ongoing effectiveness of the seagrass management strategy is evaluated every two years, when changes in seagrass acreage are mapped and provided in GIS format by the Southwest Florida Water Management District (SWFWMD). The GIS data layers produced by the mapping effort are available online.
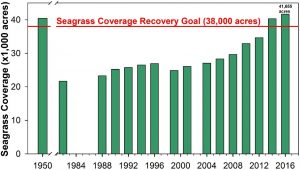 As a result of the nitrogen management projects carried out by the NMC and other TBEP partners, the goal of restoring Tamp Bay’s seagrass acreage to early-1950s levels was reached in 2014, and continued in 2016 when a total of 41,655 acres were mapped by the SWFWMD aerial mapping program.
While the acreage numbers can be expected to fluctuate from year to year, due to climatic factors (such as tropical cyclones and El Niño/La-Niña episodes) and other events that cause fluctuations in annual nitrogen loads, it appears that the ‘hold-the-line’ nitrogen management strategy has been successful so far. The challenge will be to continue to hold the line as the population of the Tampa Bay watershed continues to grow.
Sustainability – What Can I Do to Help?
There are a large number of things that residents of the Tampa Bay region can do to contribute to the bay management effort. An updated list is maintained at the TBEP website and some examples are listed below:
As a homeowner:
- Follow local guidelines for fertilizer use; use slow-release formulations and do not apply fertilizer when rain is likely during the next 24-hours (i.e., anytime during the June – September rainy season).
- Practice xeriscaping and other Florida-friendly landscaping practices (additional information is available from the Florida Native Plants Society, local Cooperative Extension Service offices, and the Southwest Florida Water Management District)
- Take appropriate steps to reduce stormwater runoff from your property (for example, by positioning gutters and downspouts to discharge to lawn or mulched areas rather than driveways or roadways)
- Improve the energy efficiency of your home and vehicles, and reduce your use of fossil fuels as much as possible
- If you own a pet, be sure to dispose of waste responsibly
- If your home uses a septic system for wastewater treatment, make sure it is properly maintained (for more information, contact your county health department)
- Reduce your use of hazardous household chemicals and dispose of chemical properly
As a worker or business owner
- Examine the sustainability of your work and business-related activities and do what you can to reduce their environmental impacts
As a boater or angler
- Follow guidelines for responsible boating and angling
As a volunteer or donor
Donate time and/or funds to support a nonprofit organization that is active in the Tampa Bay sustainability effort. For a list of some local resources, visit https://sustany.org/links
Also:
- Tampa Bay Estuary Program: Volunteer Workdays
- Tampa Bay Watch
- Restore America’s Estuaries
- Florida Department of Transportation: Adopt-A-Highway Program
- Southwest Florida Water Management District
- Hillsborough County Government Florida: Adopt-A-Pond
- Manatee County wateratlas: Adopt-A-Pond
- Pinellas County Florida: Adopt-A-Pond
- City of Tampa: Hillsborough River & Coastal Cleanup
- Keep Tampa Bay Beautiful
- Tampa Bay Association of Environmental Professionals
- Florida Fish and Wildlife Conservation Commission
- Ocean Conservancy: Coastal Cleanup
- Surfrider Foundation
- St. Petersburg: ICAN Involved Citizens Active in Neighborhoods
As a citizen
- Let your elected officials know that you support programs that support the bay such as upgrades to sewage treatment plants and stormwater management systems, environmental land acquisition and habitat restoration programs, and agencies that enforce water quality and wetland impact regulations
- Stay up to date on and be active in local government land-use decisions that could affect the health of the bay and its watershed
Information Sources and Additional Reading:
- Environmental Protection Commission of Hillsborough County (2018 and prior years) – water quality monitoring maps and data
- Southwest Florida Water Management District (2016 and prior years), Tampa Bay seagrass maps
- Tampa Bay Water Atlas
- Tampa Bay Regional Planning Council (TBRPC) and Tampa Bay Estuary Program (TBEP)(2014), Economic Valuation of the Tampa Bay Estuary (PDF)
- TBEP (2017), Tampa Bay Comprehensive Conservation and Management Plan (CCMP)
- TBEP (2018 and prior years), technical publications on the Tampa Bay management effort
- TBEP (2018 and prior years), Action Plan Database for tracking completed and ongoing nitrogen management projects
- Yates, Greening and Morrison (2011) Integrating Science and Resource Management in Tampa Bay, Florida
Post Author:
 This piece was provided by Gerold Morrison, PhD, a recently-retired environmental scientist and current Sustany® Foundation board member. Dr. Morrison has lived and worked in the Tampa Bay area since the 1980s.